Seismic Tomography Globe is an interactive globe on web browsers
Seismic Tomography Globe is a 3-D intaractive digital globe of global seismic tomography. It works on the web browser. No need to install new softwares. It can be rotated, zoomed and panned using mouse and arrow keys.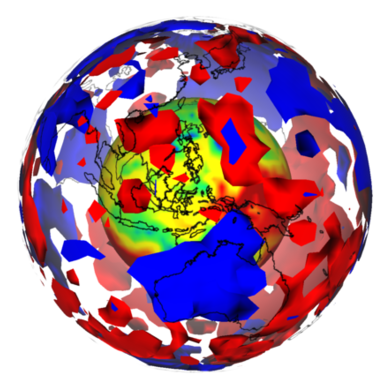
Contents
- HMSL-S06 (S-wave velocity) and HMSL-P06 (P-wave velocity)
(Houser et al., 2008) (note) - GAP_P4 (P-wave velocity) (very heavy!)
(Obayashi et al., 2013, Fukao and Obayashi, 2013) (note) - S362ANI (S-wave velocity) and S362WMANI (radial anisotropy)
(Kustowski et al., 2008) (note) - SEMUCB_WM1 (S-wave velocity and radial anisotropy)
(French and Romanowicz 2014, Fench et al., 2013) (note) - SP12RTS (S-wave, P-wave, and bulk sound velocity)
(Koelemeijer et al., 2016) (note)
About This Application
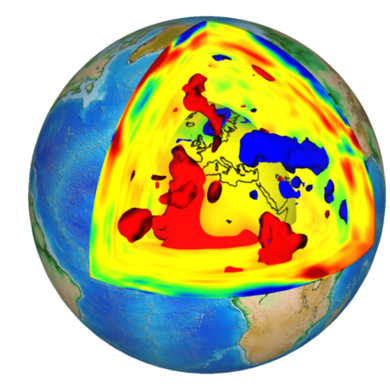
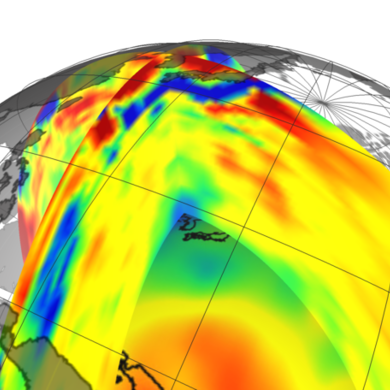
This application works on web browsers in JavaScript using WebGL. Global seismic tomography data are downloaded on your browser and then the browser calculates the data to create images on your display. Seismic tomography is a method for exploring the inside of the Earth by seismic waves. The heterogeneities of the seismic wave speeds are related to temperature and compositional variations inside the Earth. For example, low seismic velocity regions (usually visualized by red) are inferred to be hotter than the surrounding regions and high seismic velocity regions (usually blue) are colder. In this web application, the difference of wave speed is visualized by the difference of color on vertical and horizontal cross-sections inside the mantle, which occupies more than 80 percent of the Earth by volume. Isosurface of the velocity speed is also visualized so that the scales and shapes of ascending plumes (hotter upwellings of rocks) and descending slabs (colder descending plates) are inferred to correspond those of isosurfaces. The Earth's mantle is made of solid rocks but it deforms like a fluid in a long period of time. The flow in the mantle (referred to as mantle convection) is driven by temperature and compositional differences, which can be inferred from seismic tomography. Now let's explore the interior of the dynamic Earth.