Note for GAP_P4
Description for GAP_P4
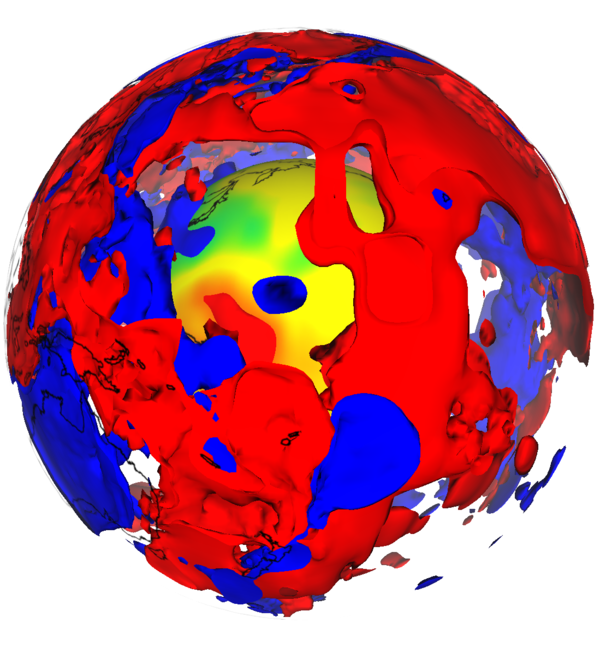
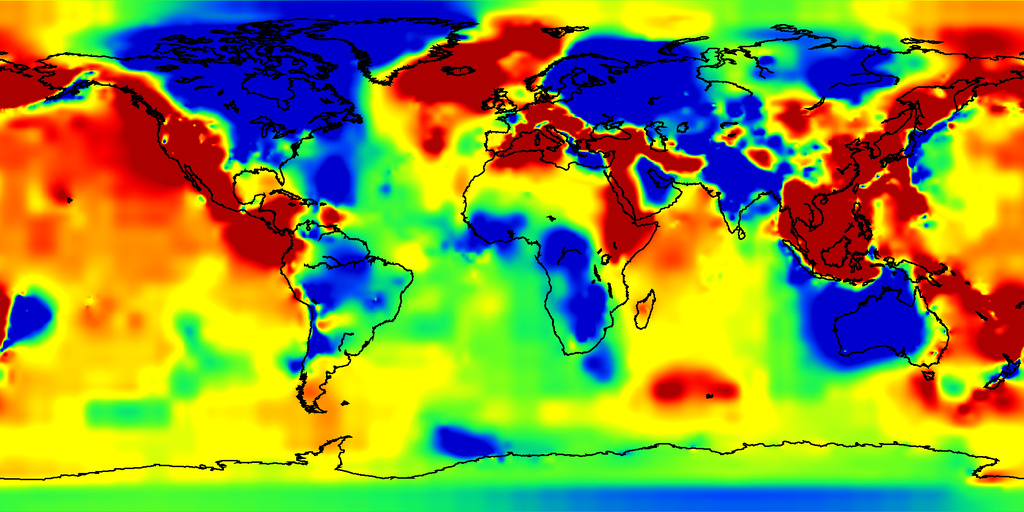
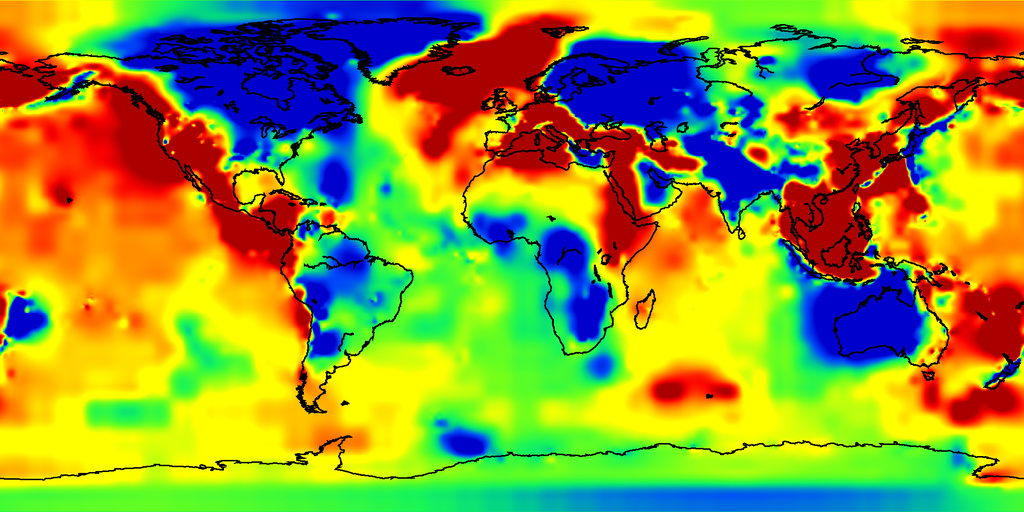
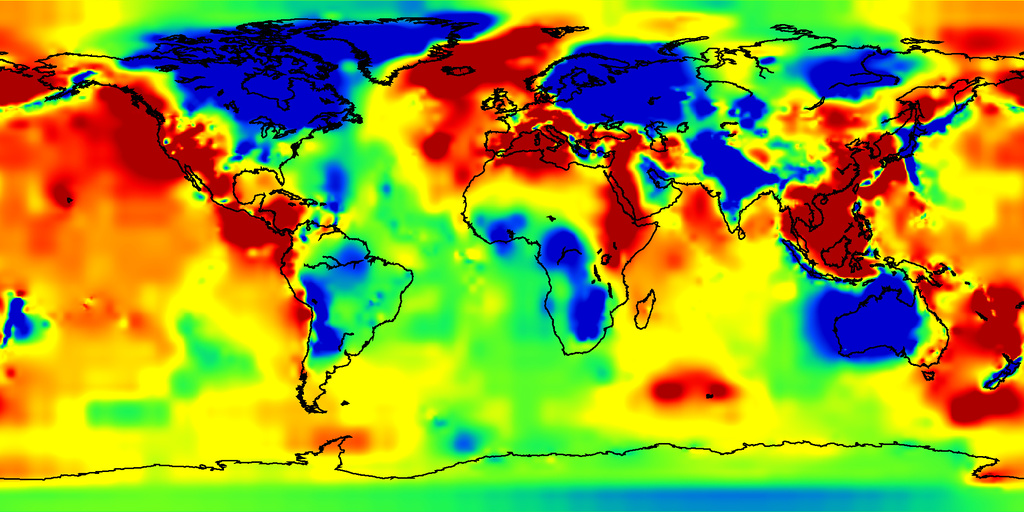
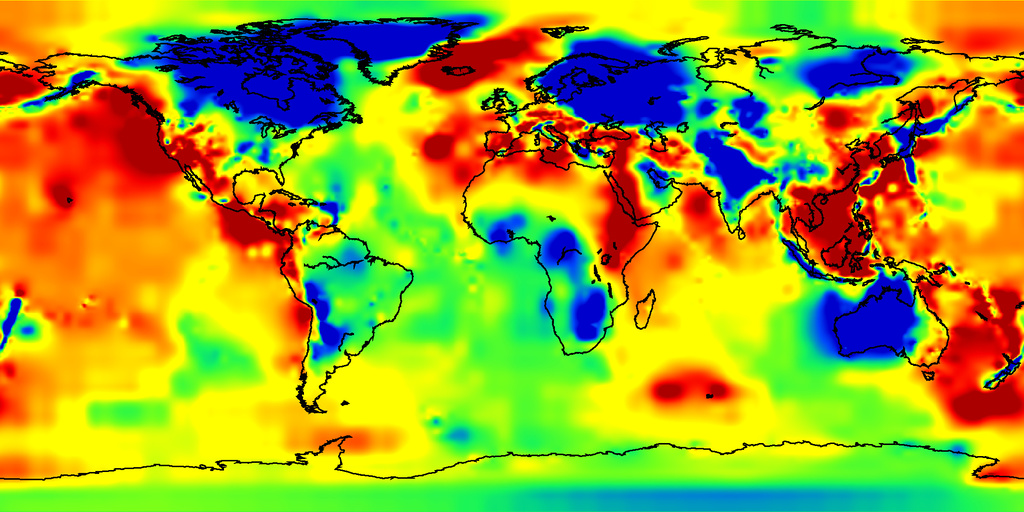
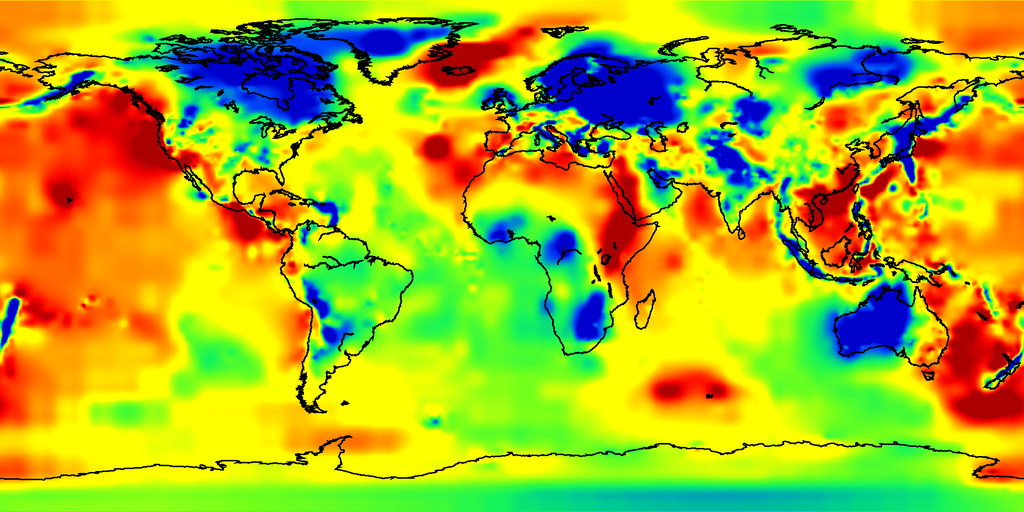
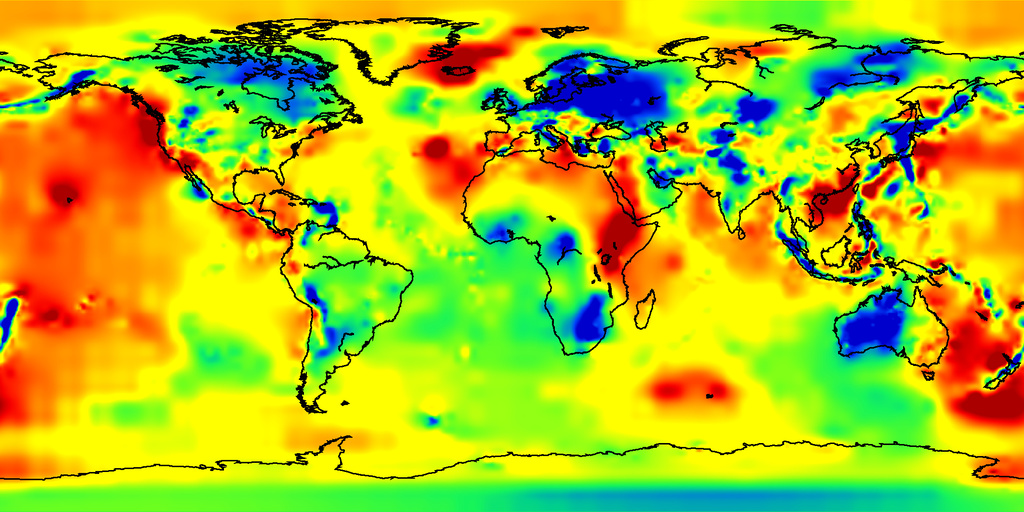
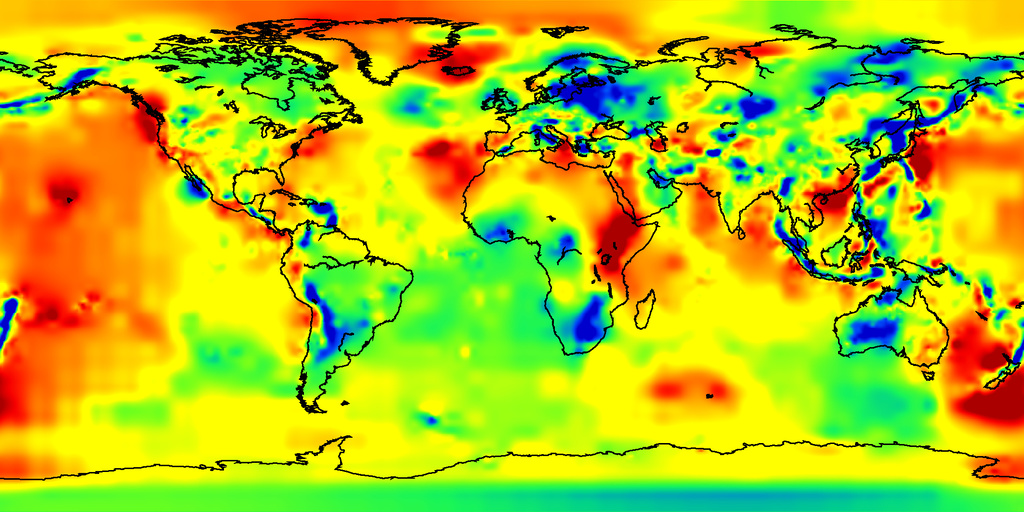
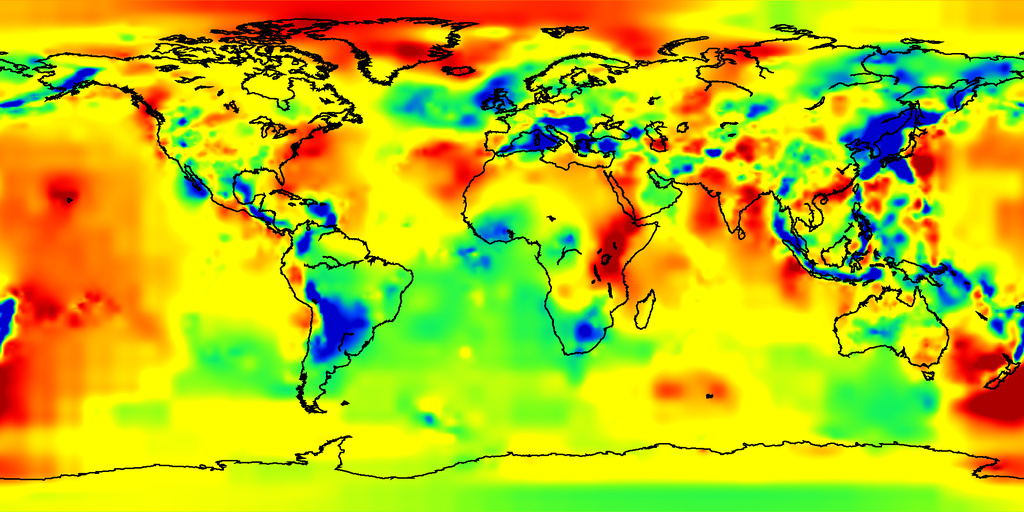
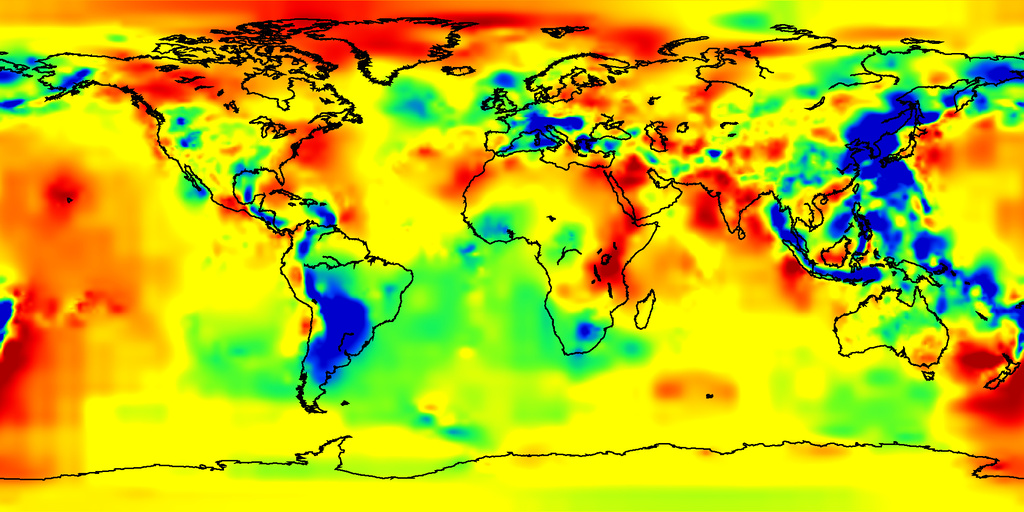
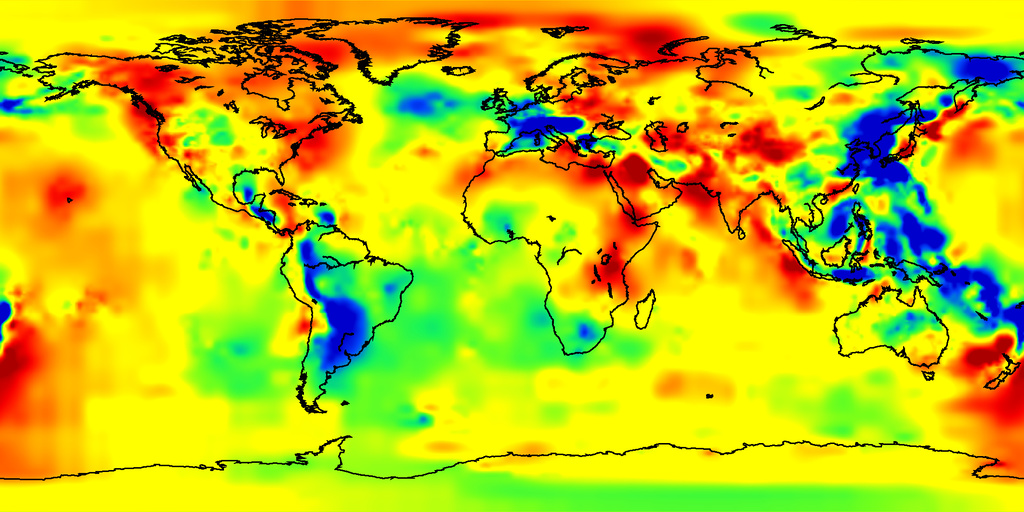
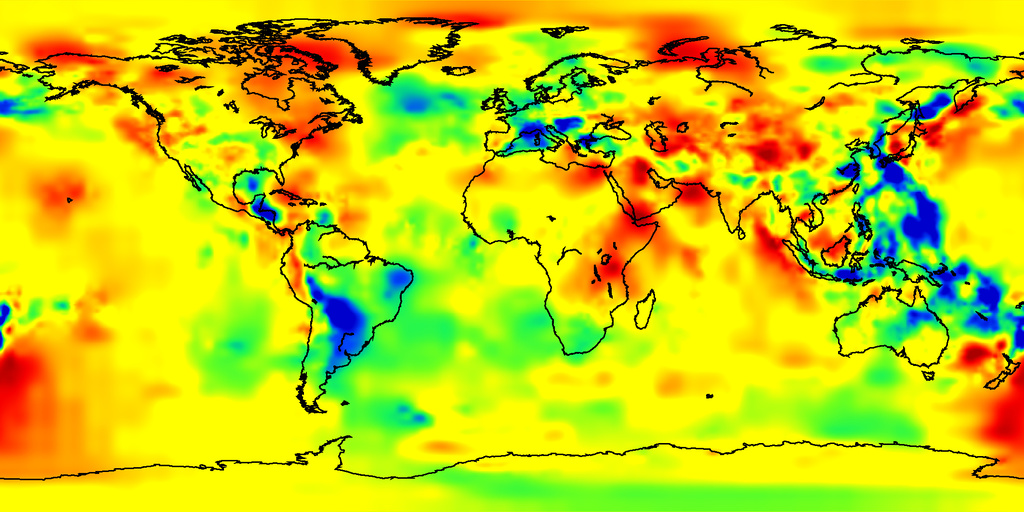
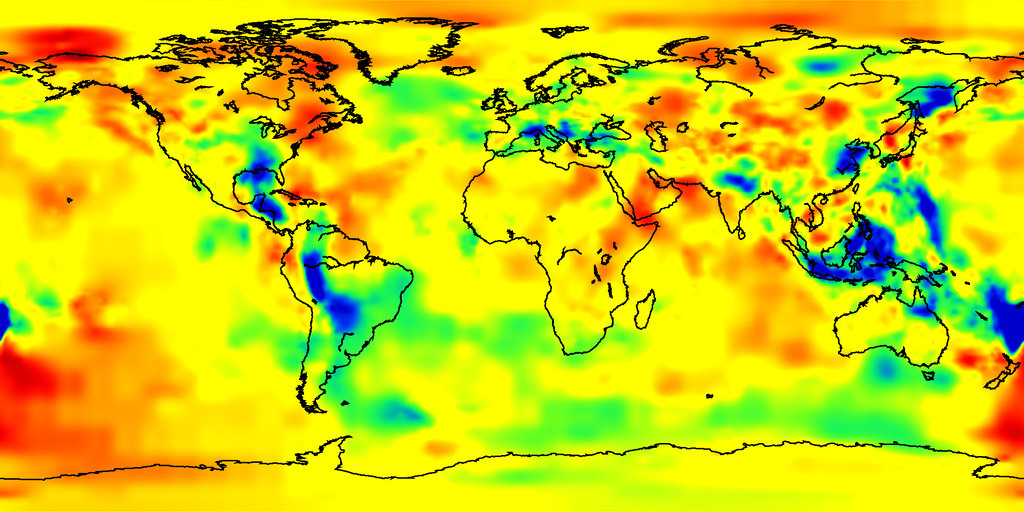
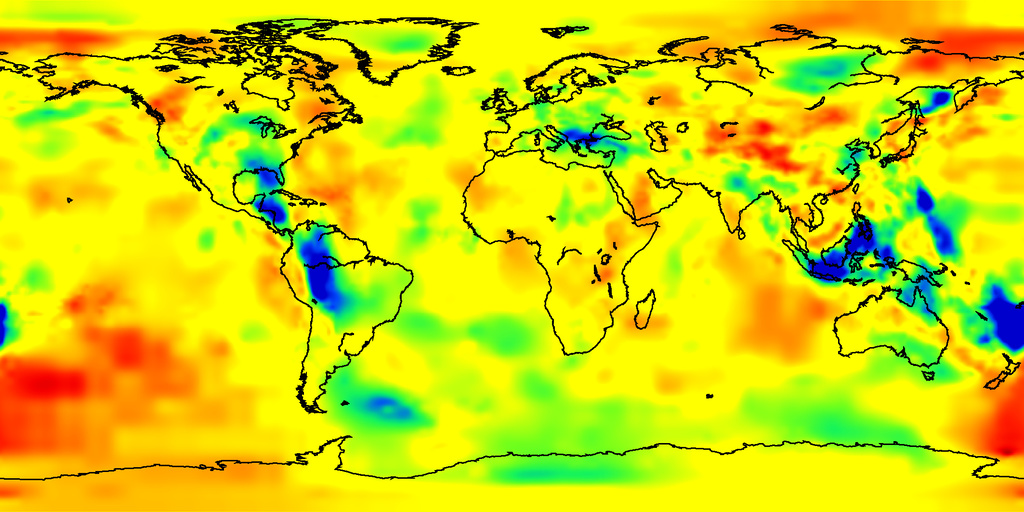
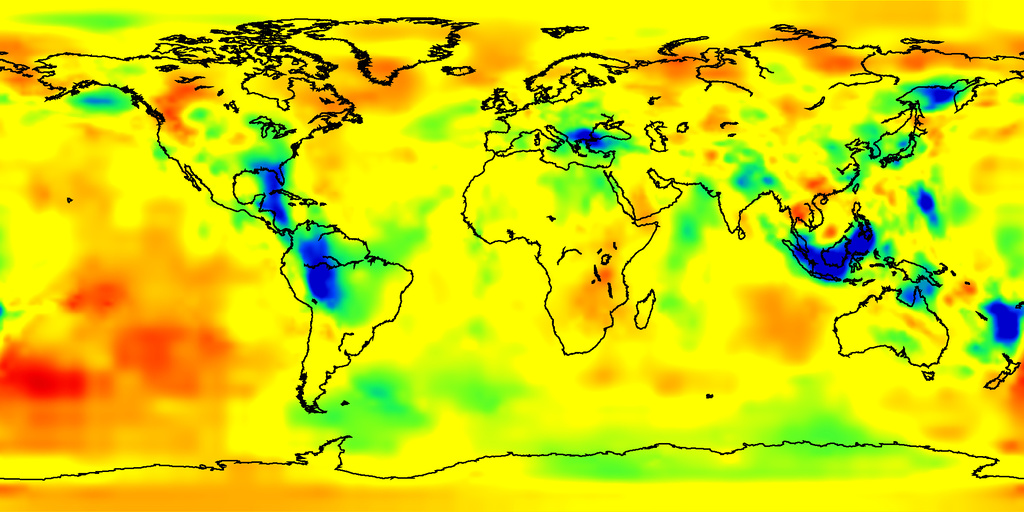
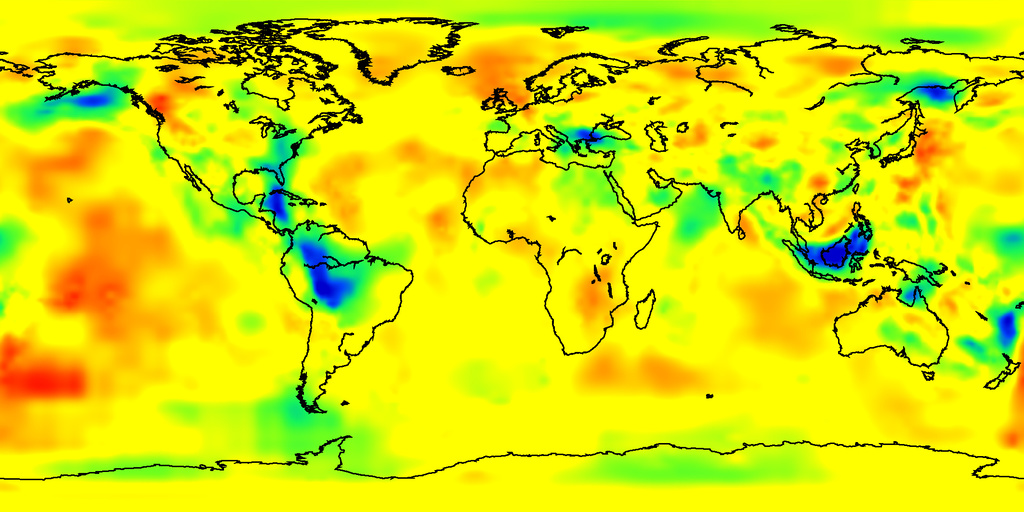
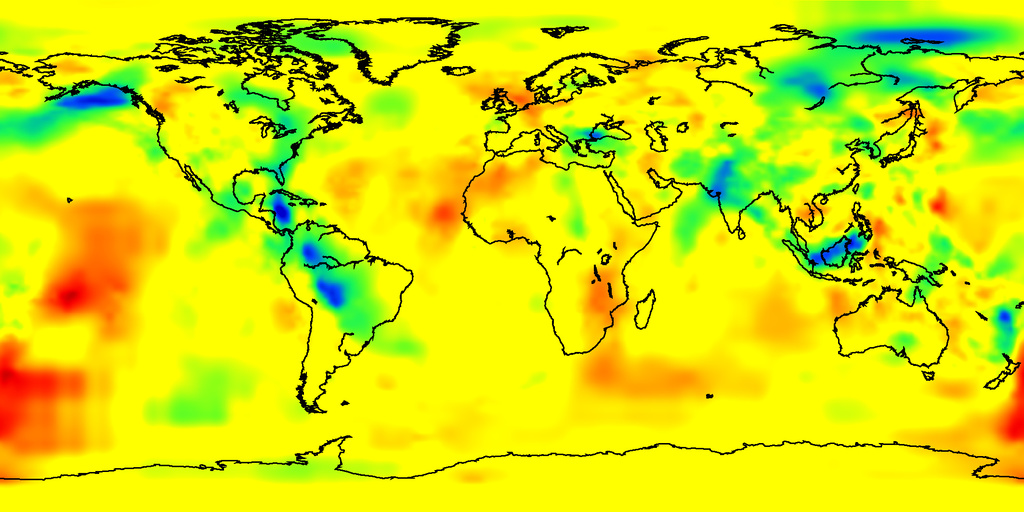
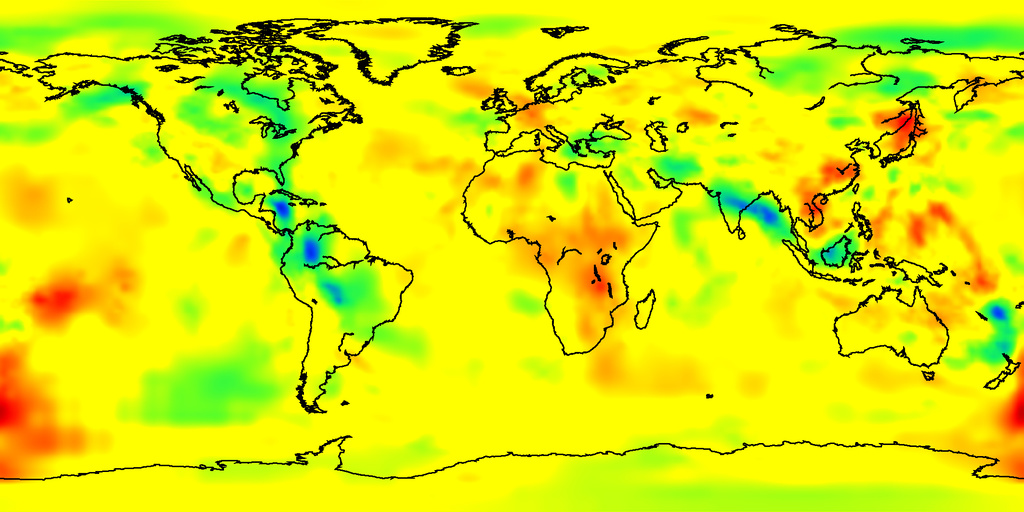
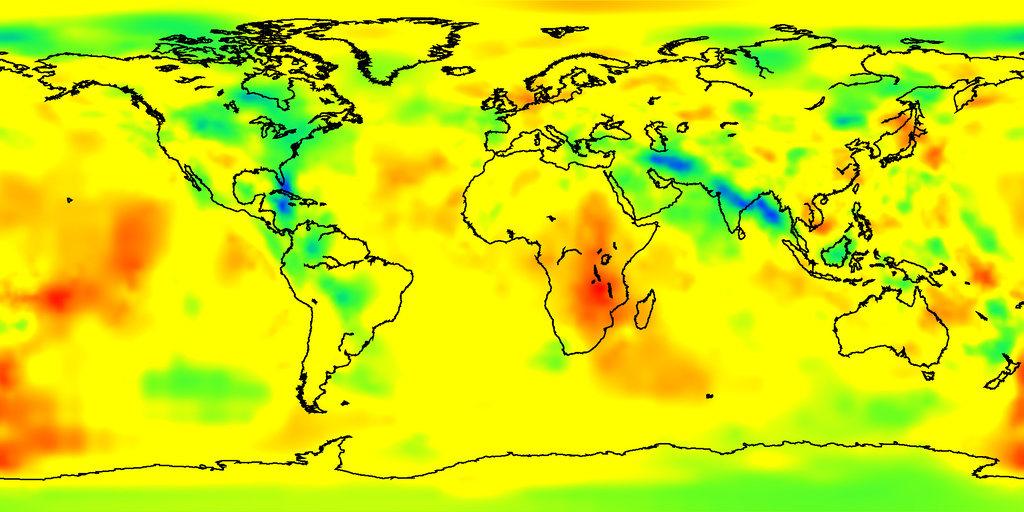
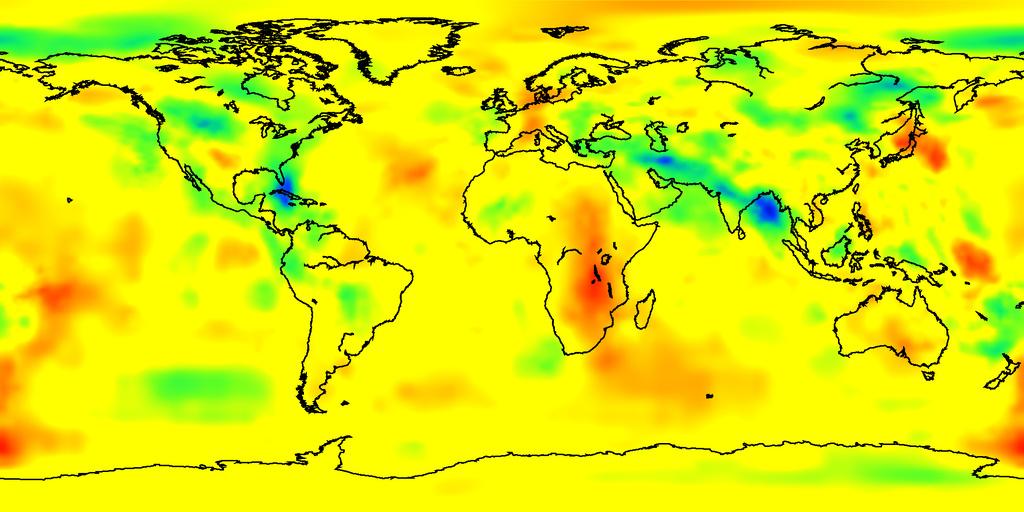
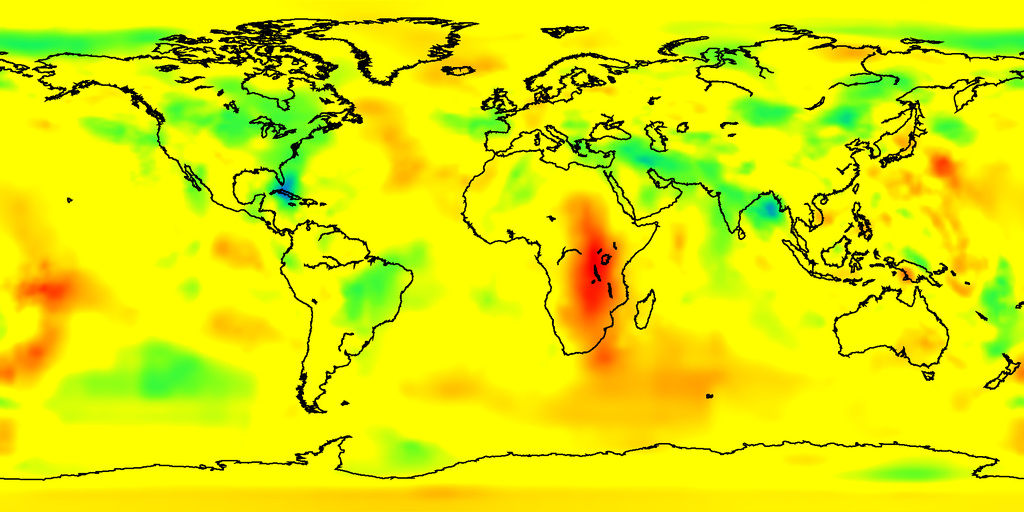
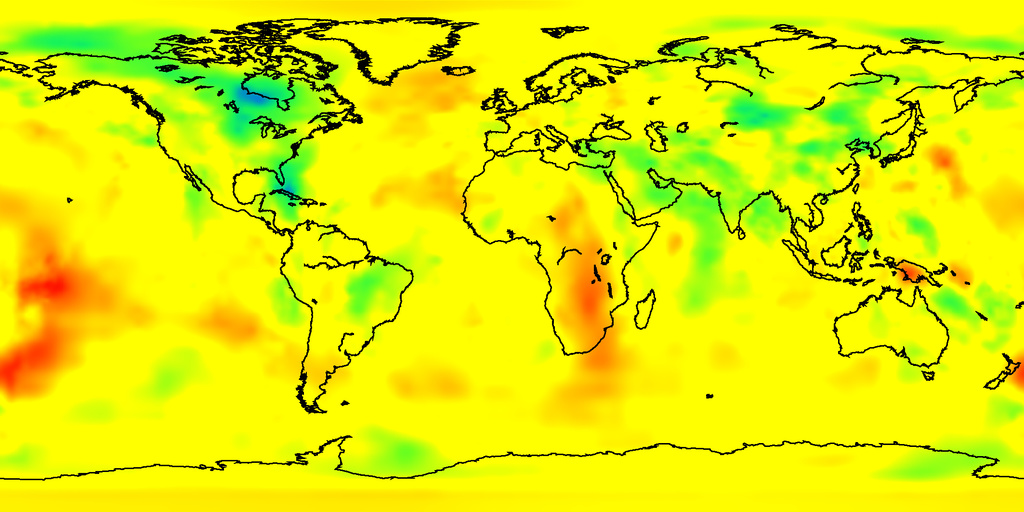
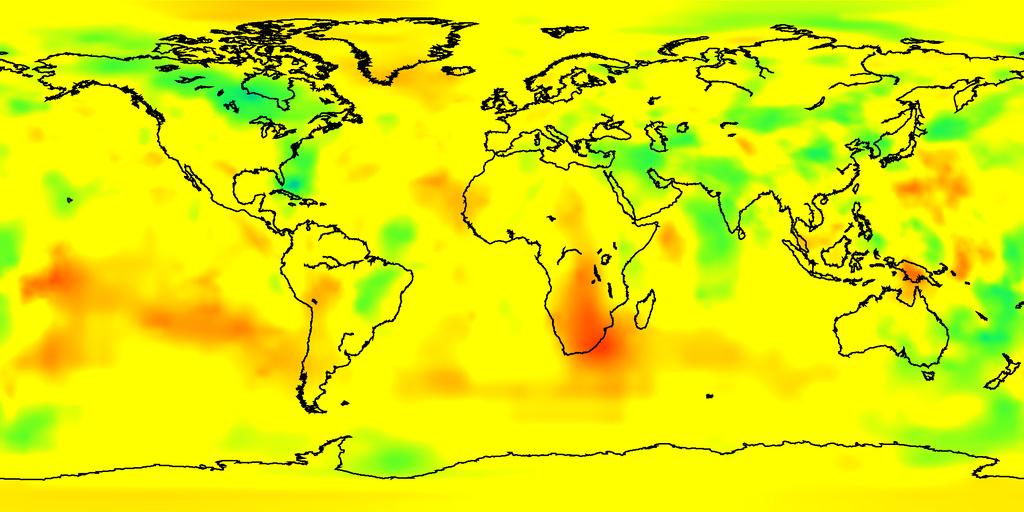
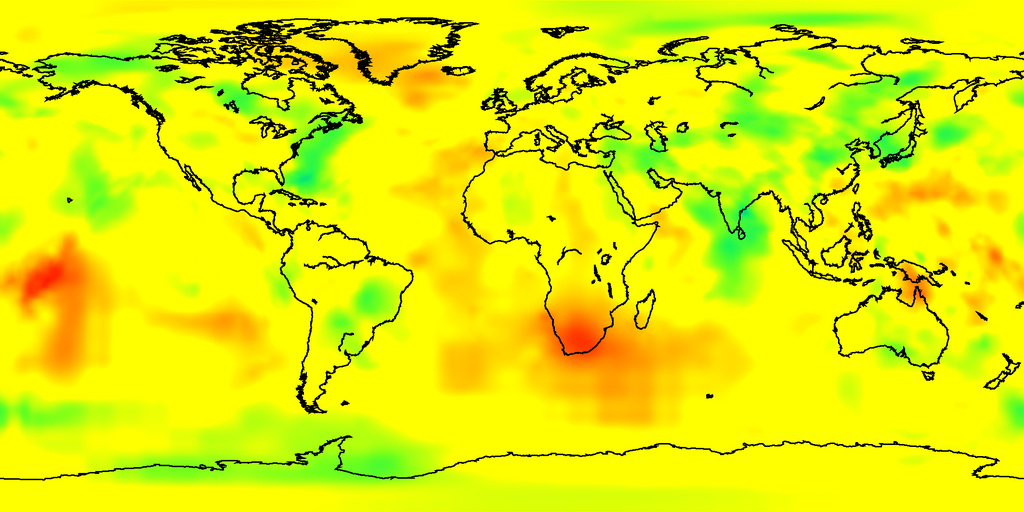
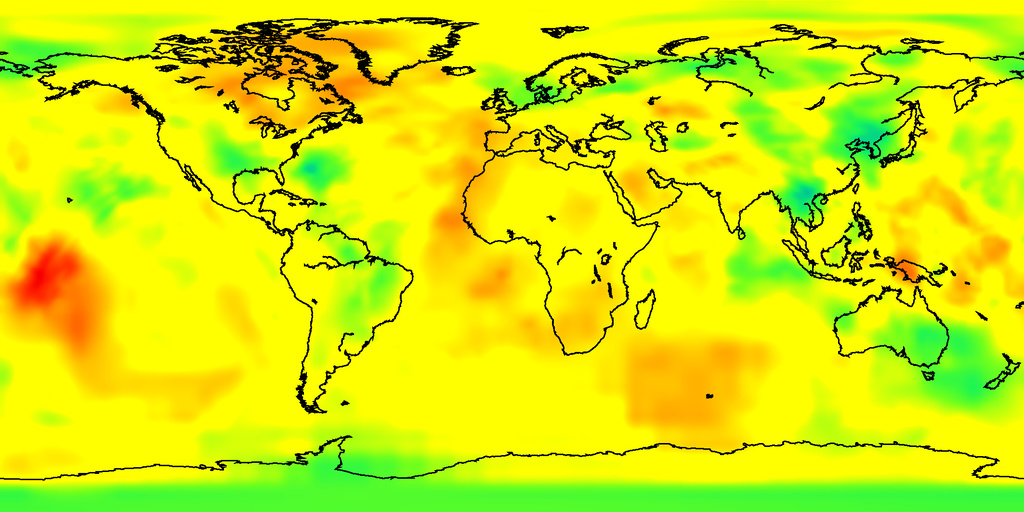
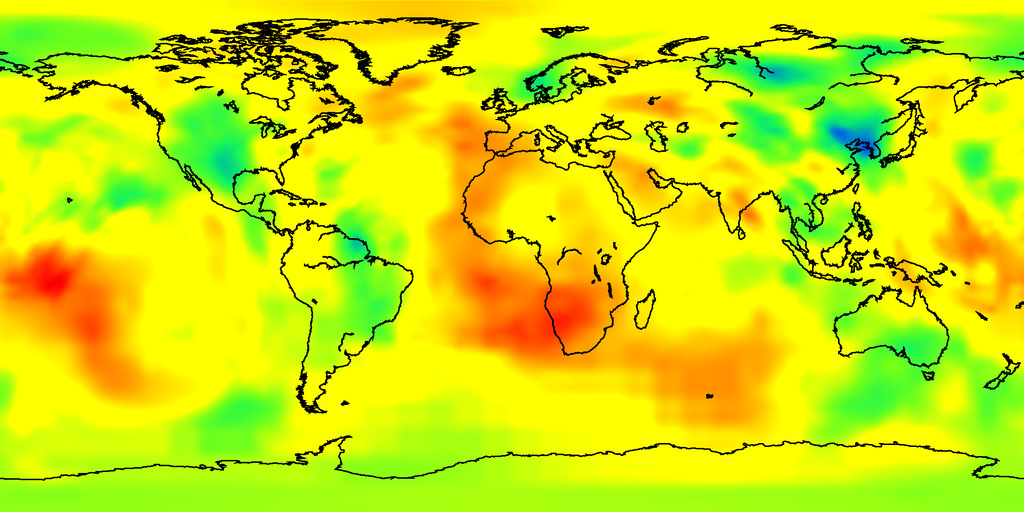
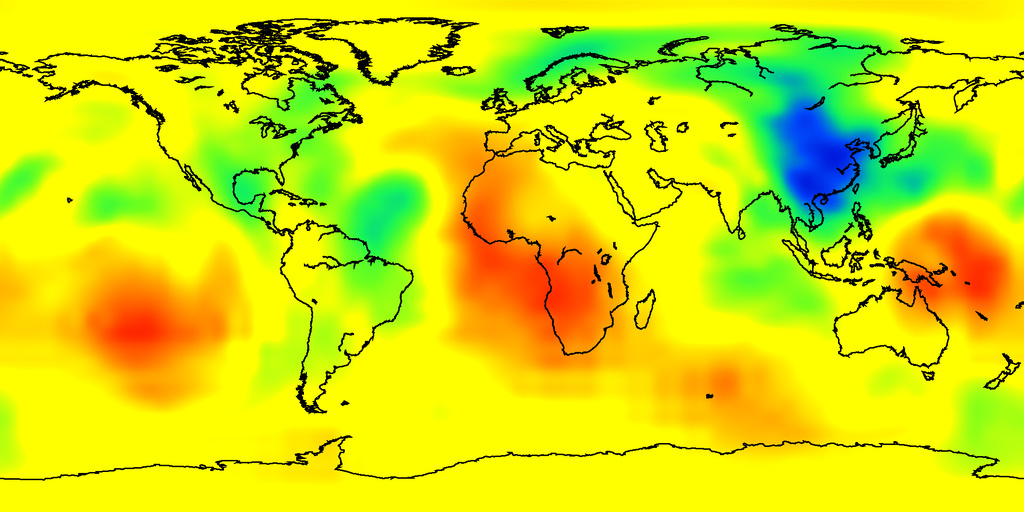
Seismic tomography model
Color Scale
- P-wave (Download colorbar (eps))
Seismic tomography model: GAP_P4 (velocity perturbation of P-wave), Obayashi M. et al., Finite frequency whole mantle P-wave tomography: Improvement of subducted slab, Geophys. Res. Lett., (2013), Fukao Y., M. Obayashi, Subducted slabs stagnant above, penetrating through and trapped below the 660-km discontinuity. J. Geophys. Res., (2013)
The horizontal resolusion is reduced from the original 576 x 288 (longitude x latitude) to 288 x 144.
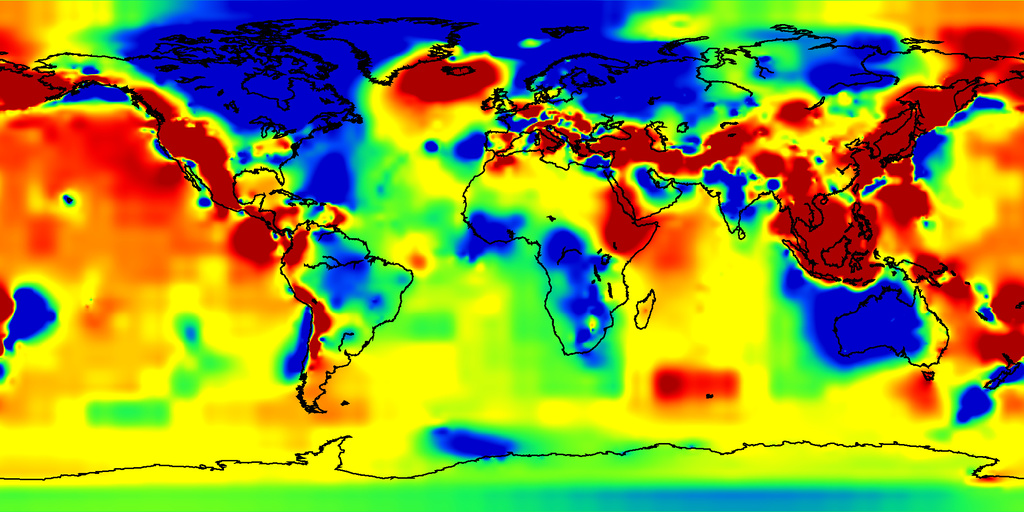
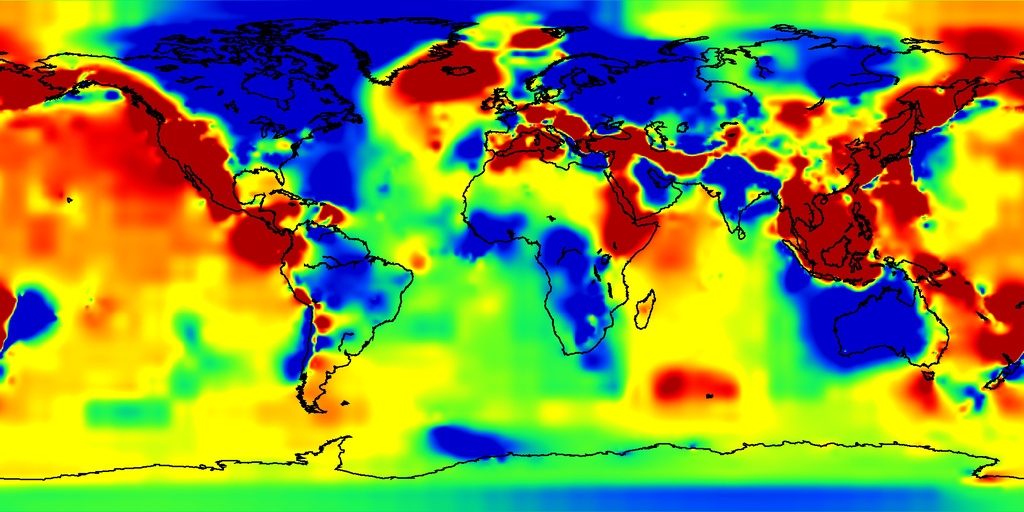
IsoDepth Texture Map
P-wave velocity map (depth): 29-51 km, 51-78 km, 78-110 km, 110-148 km, 148-190 km, 190-238 km, 238-290 km, 290-348 km, 348-410 km, 410-478 km, 478-551 km, 551-629 km, 629-712 km, 712-800 km, 800-893 km, 893-991 km, 991-1095 km, 1095-1203 km, 1203-1317 km, 1317-1435 km, 1435-1559 km, 1559-1688 km, 1688-1821 km, 1821-1960 km, 1960-2104 km, 2104-2253 km, 2253-2407 km, 2407-2566 km, 2566-2891 km,
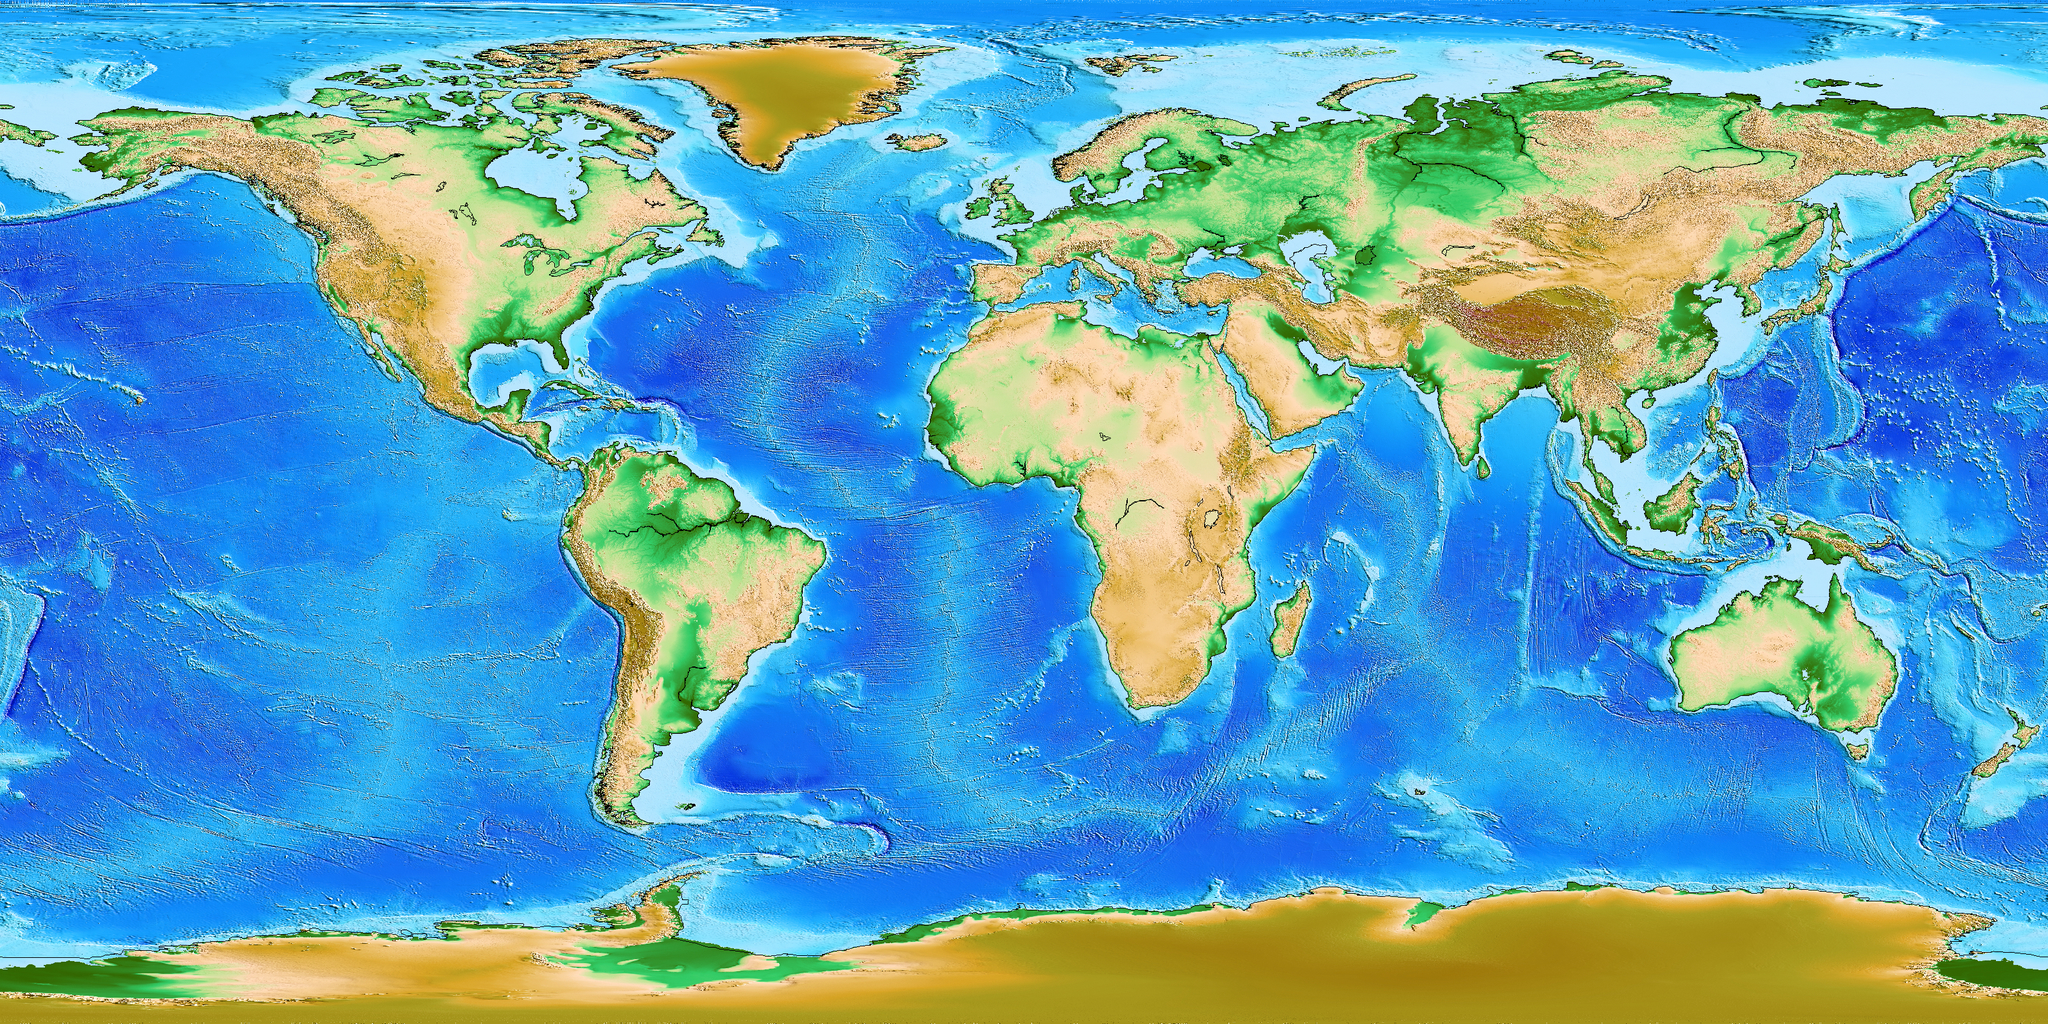
Description for the Earth's surface data
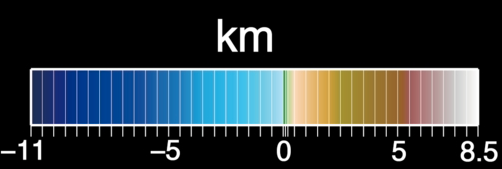
Topography: ETOPO1
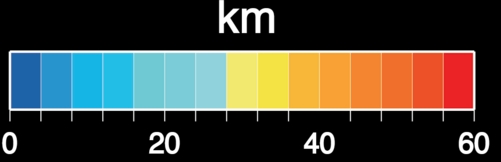
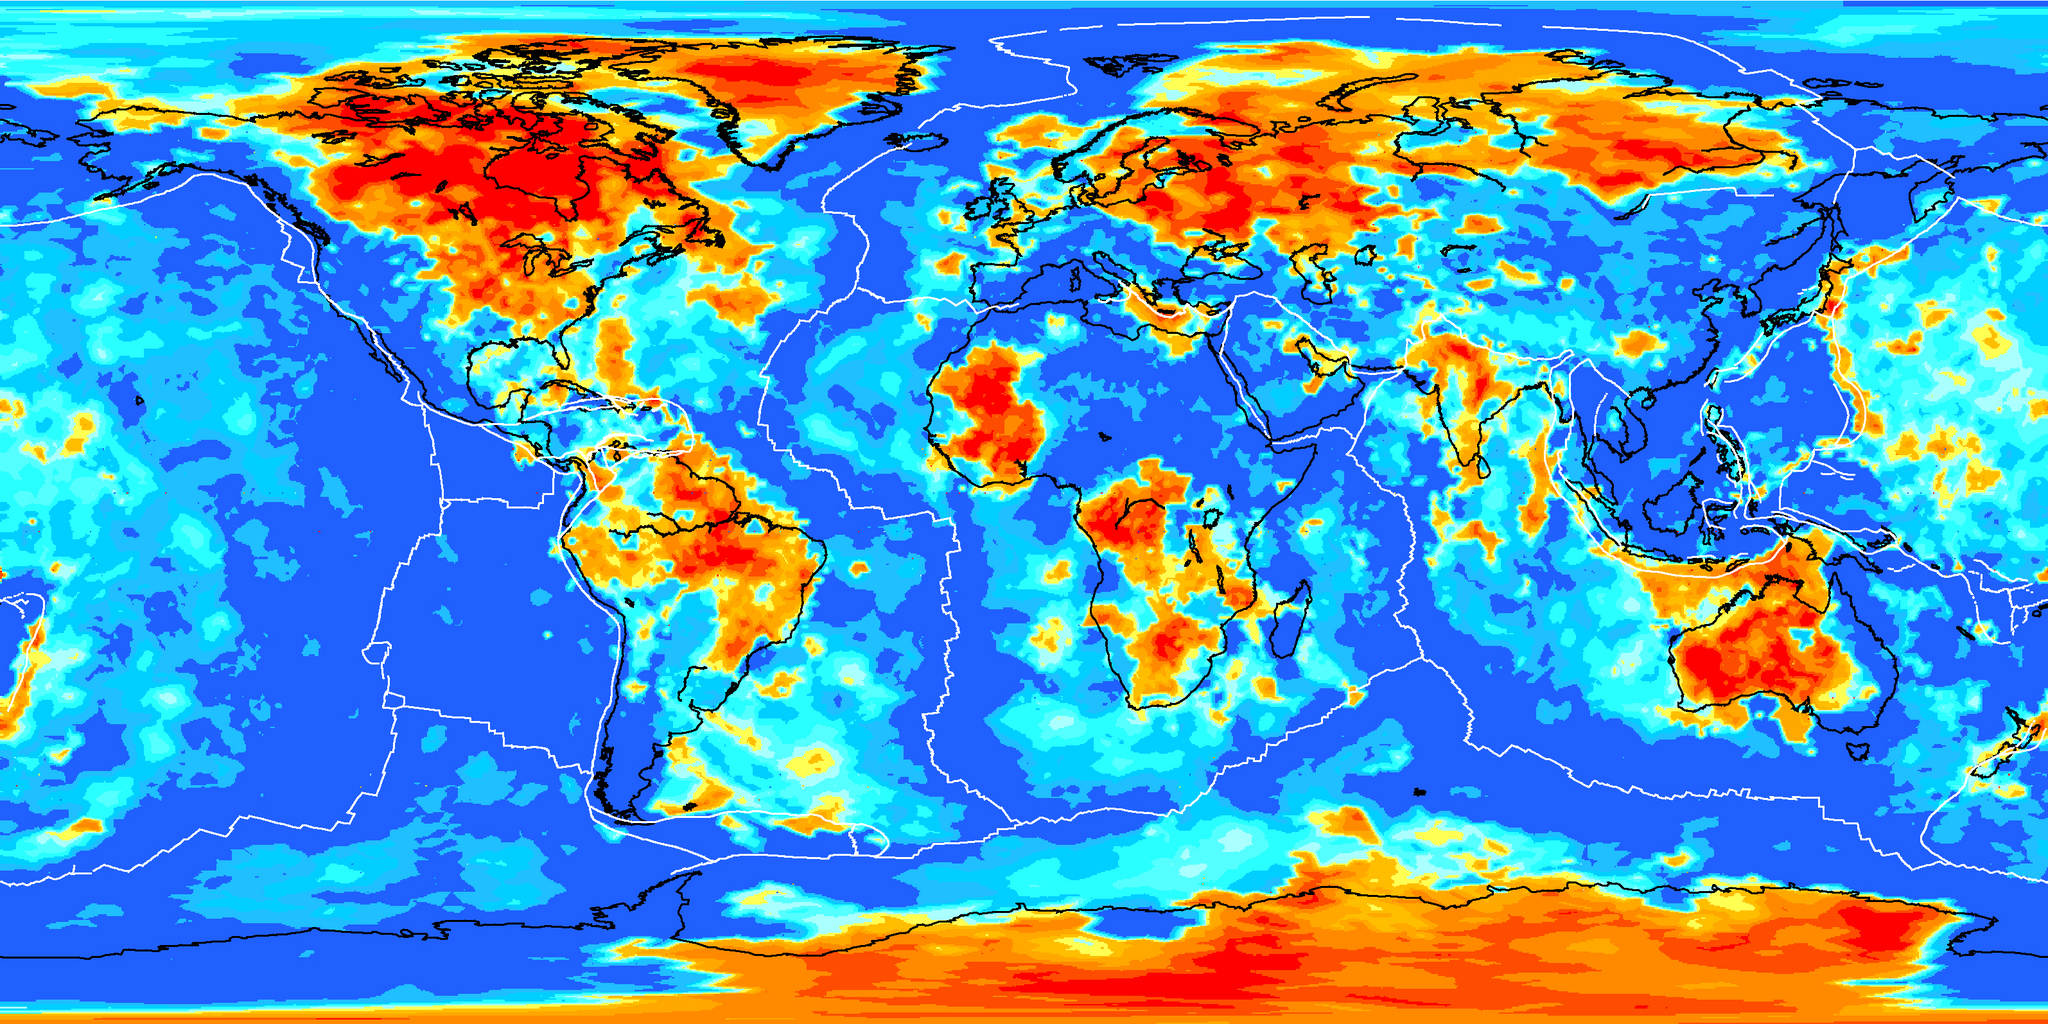
Moho depth: CRUST1.0
Depth of lithosphere-asthenosphere boundary: LITHO1.0 (Tessellation level 7)
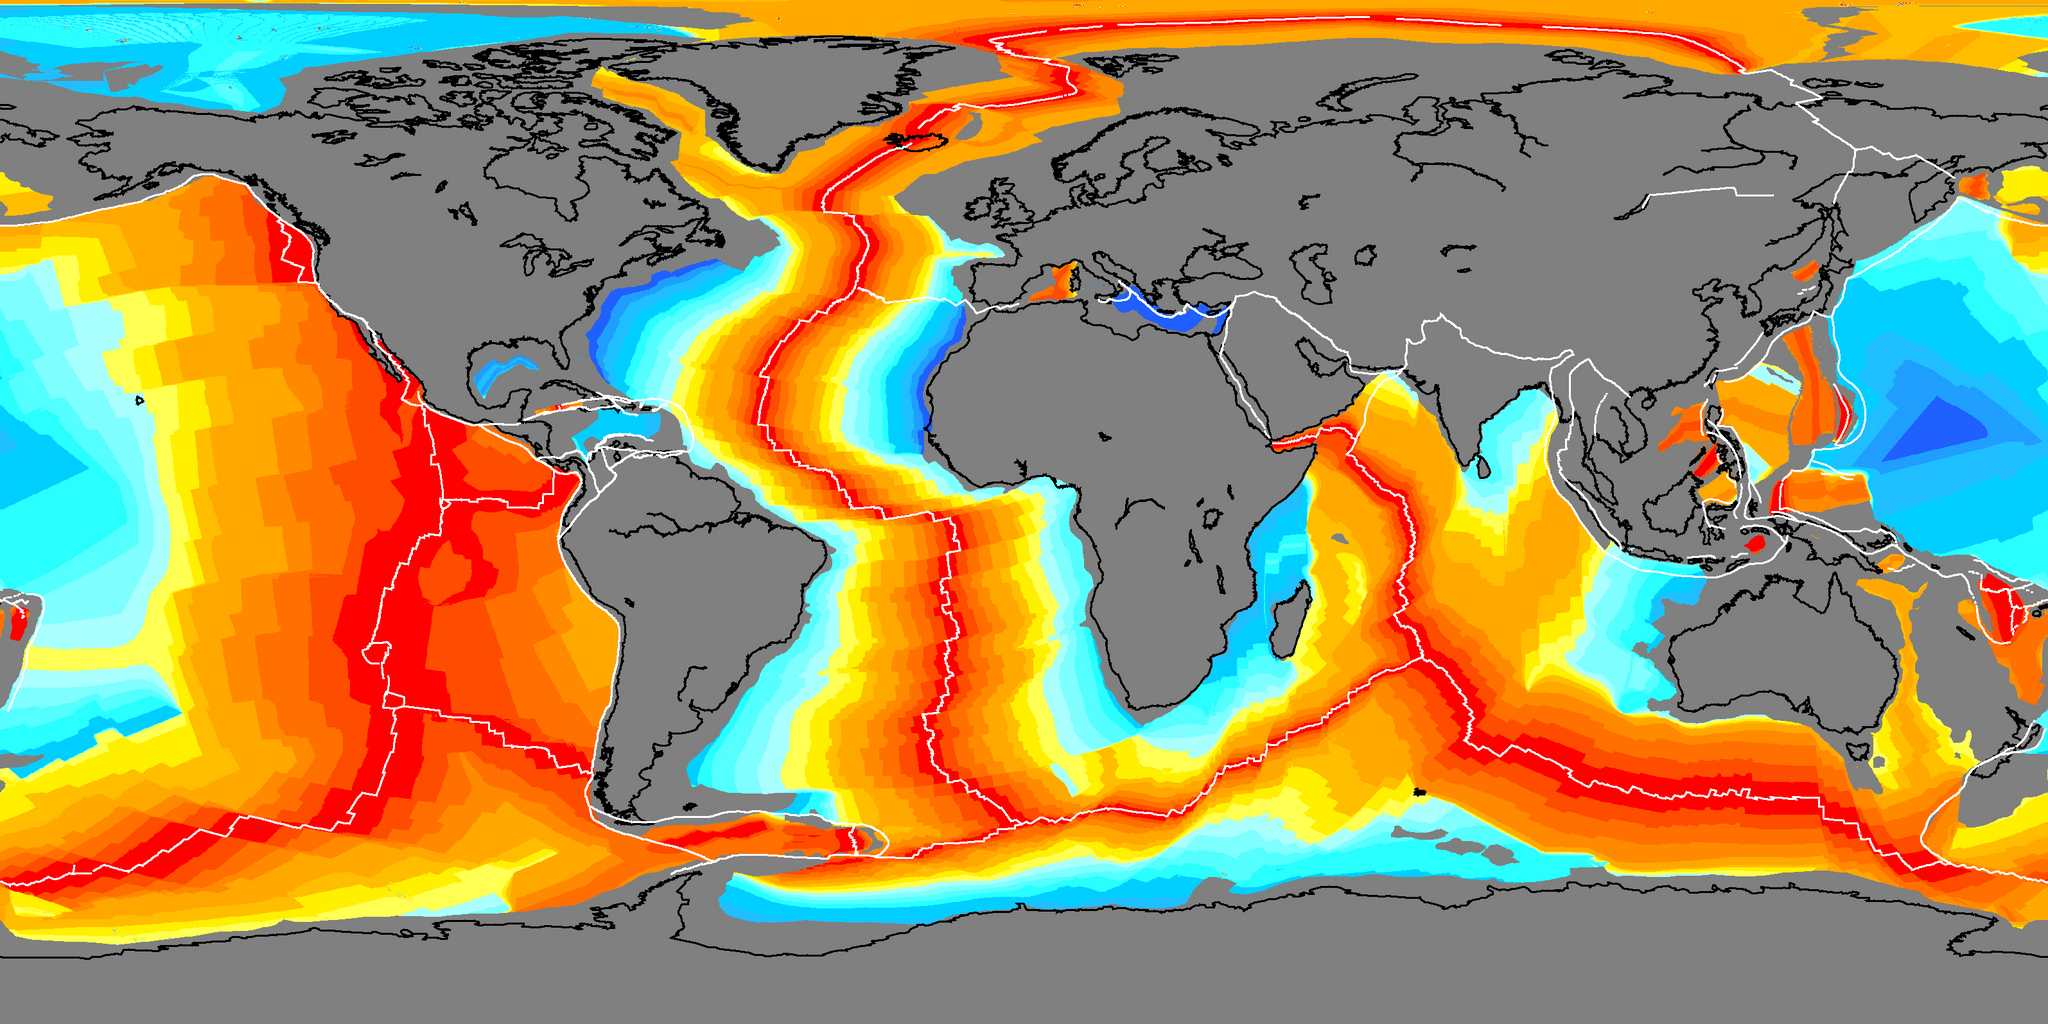
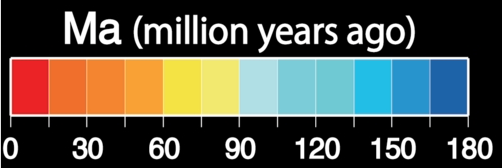
Formation time of ocean floor: Agegrid (Earth Byte)
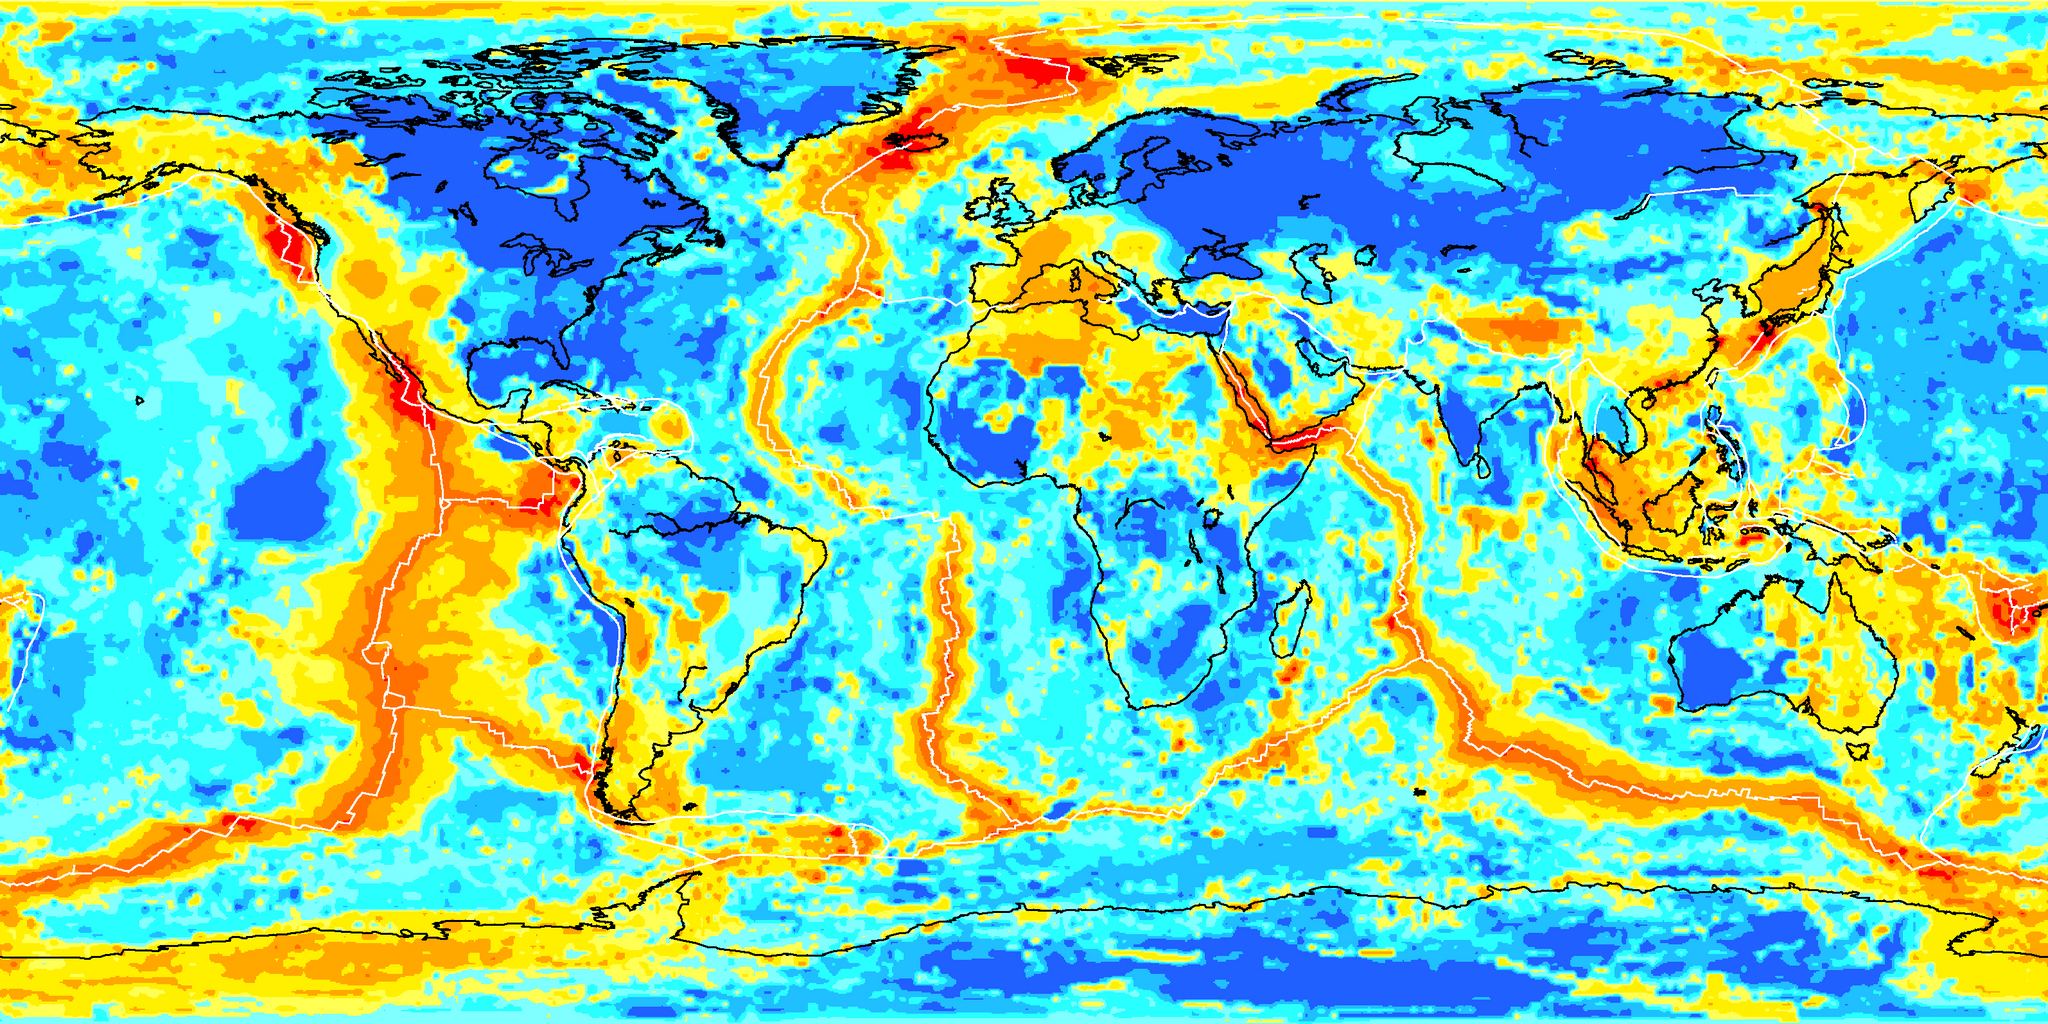
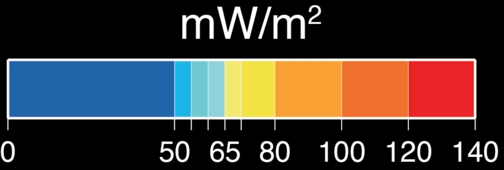
Terrestrial heat flow
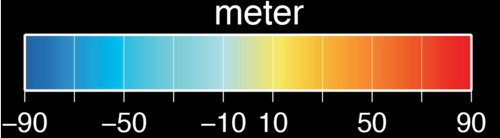
Geoid height: EGM2008
Free-air and Bouguer gravity anomalies: WGM2012
Amante, C; Eakins, B W (2009): ETOPO1, Global Relief Model converted to PanMap layer format. NOAA-National Geophysical Data Center, PANGAEA, doi:10.1594/PANGAEA.769615 (Download colorbar (eps), texture (jpg))
Laske, G., Masters., G., Ma, Z. and Pasyanos, M., Update on CRUST1.0 - A 1-degree Global Model of Earth's Crust, Geophys. Res. Abstracts, 15, Abstract EGU2013-2658, 2013 (Download colorbar (eps), texture (jpg))
Pasyanos, M.E., T.G. Masters, G. Laske, and Z. Ma (2014). LITHO1.0: An updated crust and lithospheric model of the Earth, J. Geophys. Res., 119 (3), 2153-2173, DOI: 10.1002/2013JB010626 (Download colorbar (eps), texture (jpg))
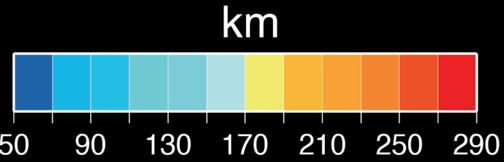
Müller, R.D., M. Sdrolias, C. Gaina, and W.R. Roest 2008. Age, spreading rates and spreading symmetry of the world's ocean crust, Geochem. Geophys. Geosyst., 9, Q04006, doi:10.1029/2007GC001743 (Download colorbar (eps), texture (jpg))
Goutorbe, B., J. Poort, F. Lucazeau, and S. Raillard (2011), Global heat flow trends resolved from multiple geological and geophysical proxies, Geophys. J. Int., 187, 1405–1419 (Download colorbar (eps), texture (jpg))
Nikolaos K. Pavlis, Simon A. Holmes, Steve C. Kenyon, John K. Factor, The development and evaluation of the Earth Gravitational Model 2008 (EGM2008), Journal of Geophysical Research: Solid Earth, 117, B4, 2012 (Download colorbar (eps), texture (jpg))
Balmino, G., Vales, N., Bonvalot, S. and Briais, A., 2011. Spherical harmonic modeling to ultra-high degree of Bouguer and isostatic anomalies. Journal of Geodesy. DOI 10.1007/s00190-011-0533-4 (Download colorbar (eps), texture (jpg) for Free-air anomaly. colorbar (eps), texture (jpg) for Bouguer anomaly)
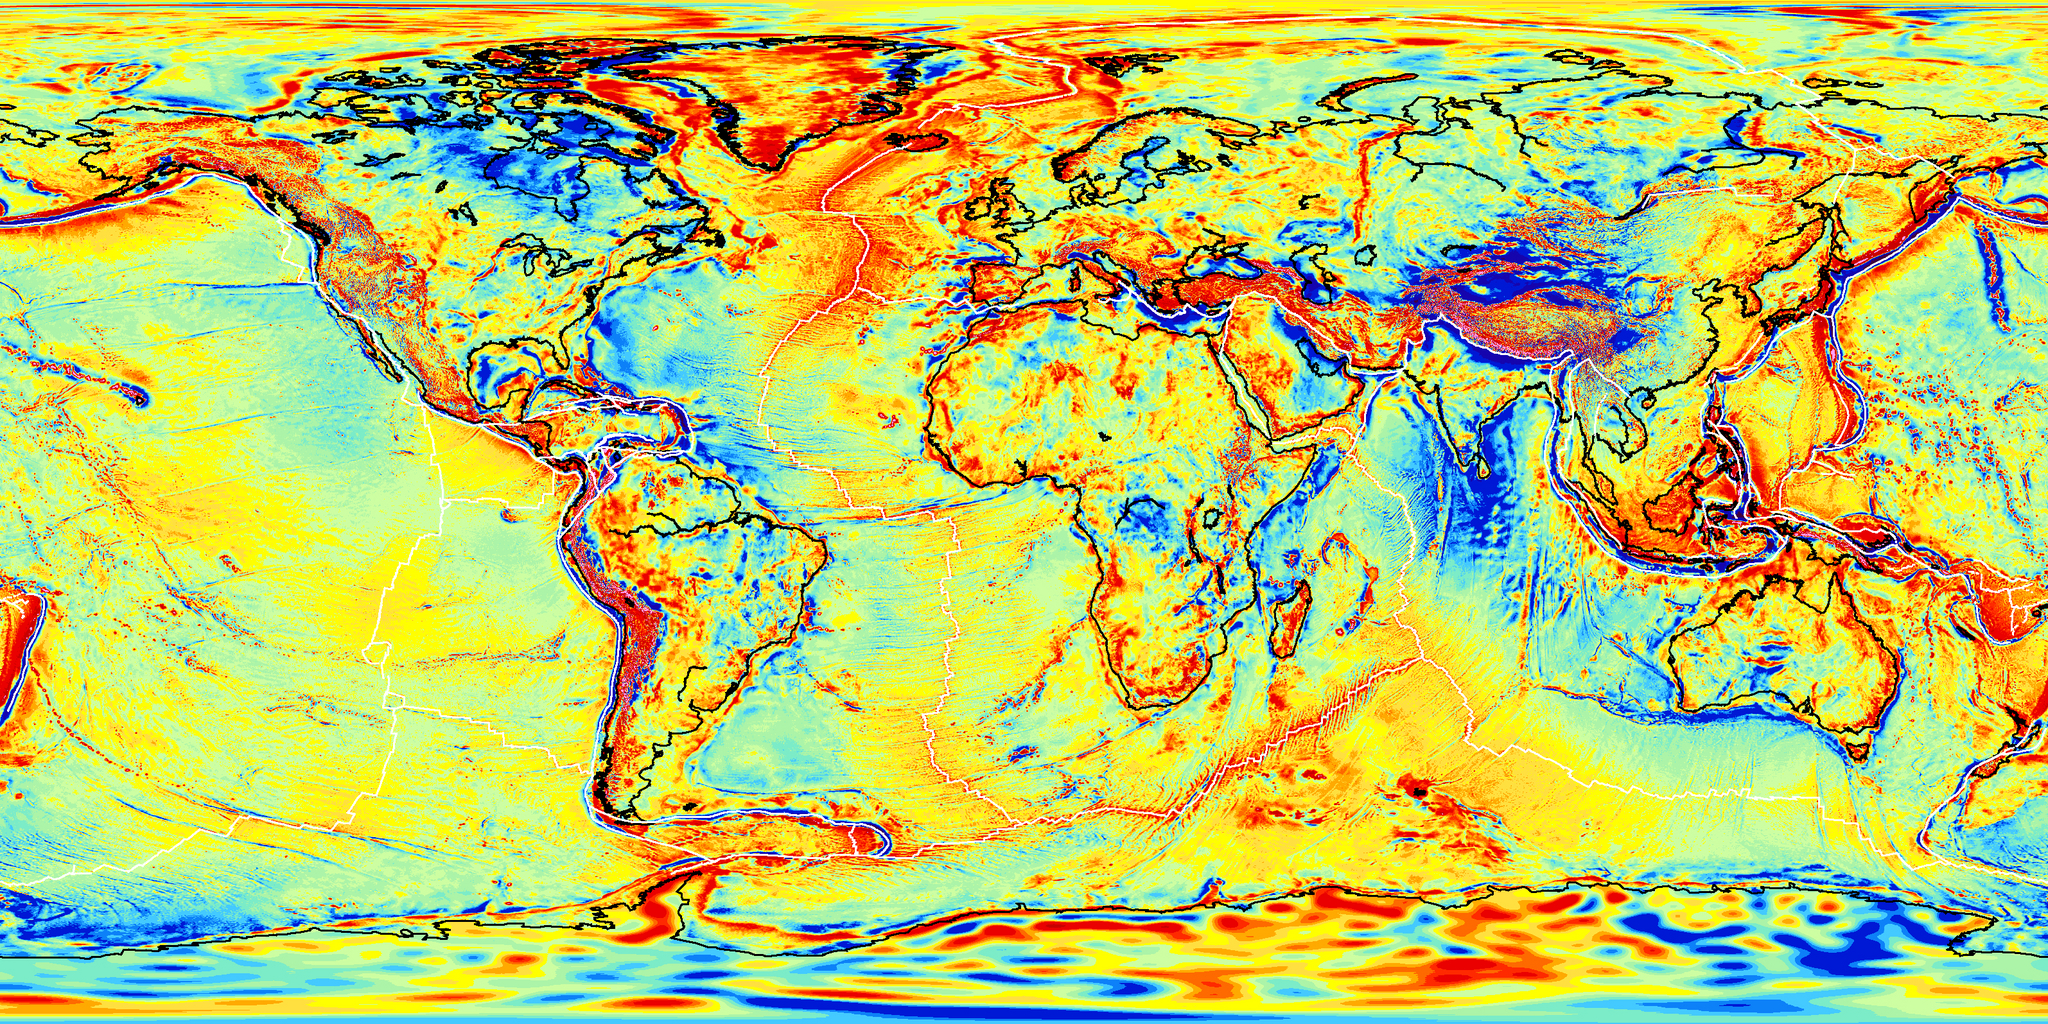
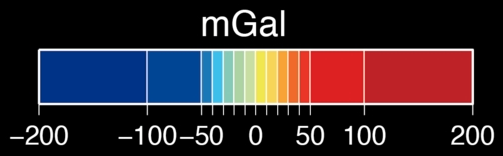
for Free-air anomaly.
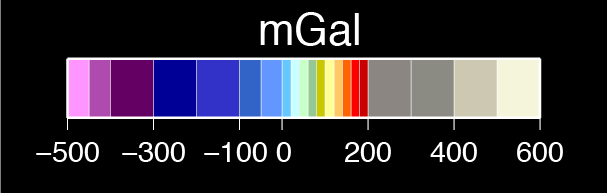
for Bouguer anomaly.
Map Creation
All the isodepth maps are created by Generic Mapping Tool (GMT) except for an image with cloud.
GMT: Wessel,P. and W.H.F.Smith, New, improved version of Generic Mapping Tools released, EOS Trans. Amer. Geophys. U., vol.79 (47), pp.579, 1998
Image with cloud: Tom Patterson, www.shadedrelief.com