User Guide
- Mouse drag: Rotation
- Mouse scroll: Scaling
- Arrow keys: Displacement of the Earth
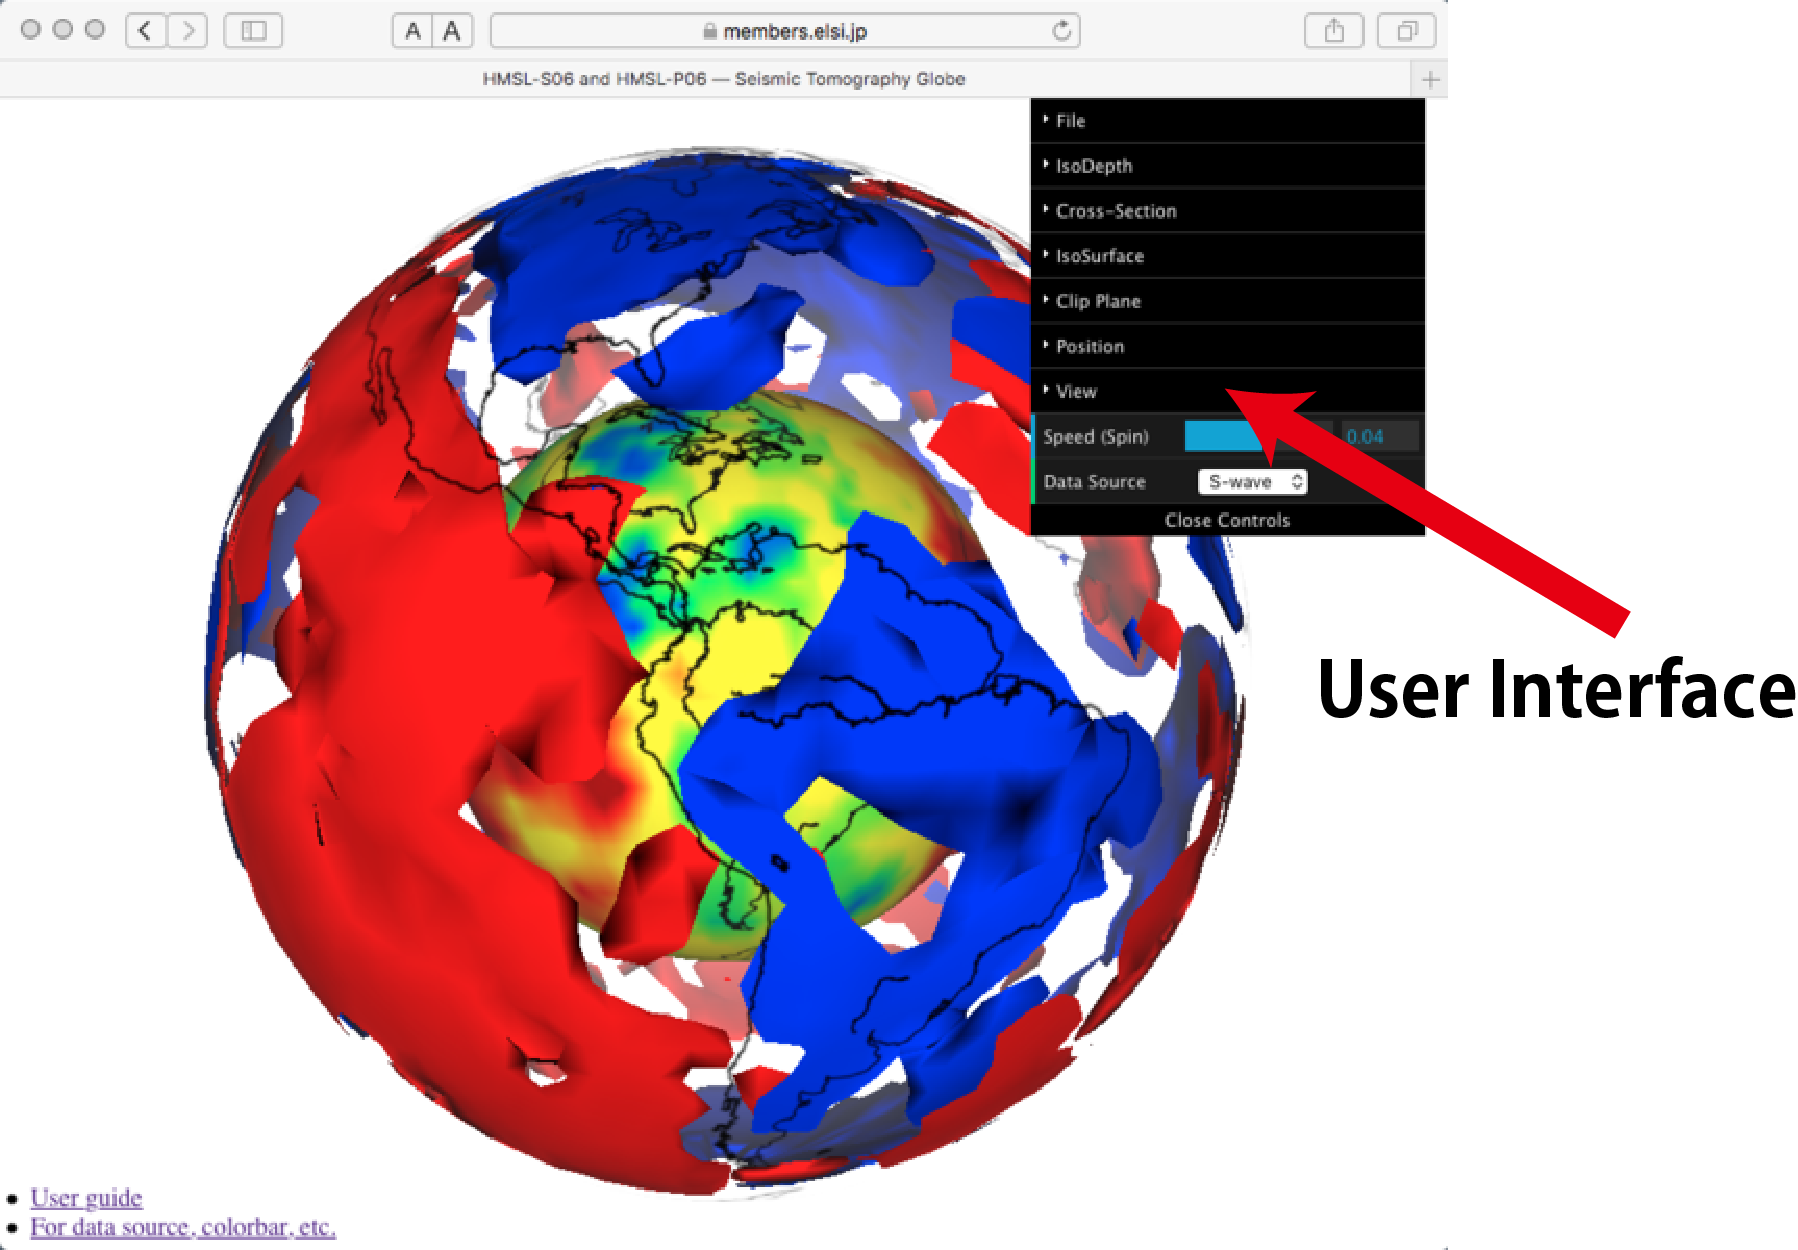
- Control parameters can be handled by the User Interface
Simple Usage
Guide for User Interface Parameters
File
- Import config file You can download the control parameters on your device. The configuration file (.json) at the moment of pusshing the botton is downloaded. The configuration file contains the control parameters of this web application. It is written by text data.
- Export config file You can upload a configuration file on your device and restart the visualization.
- ScreenShot Screenshot is made and downloaded into your device.
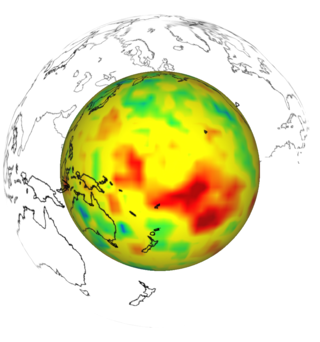
IsoDepth
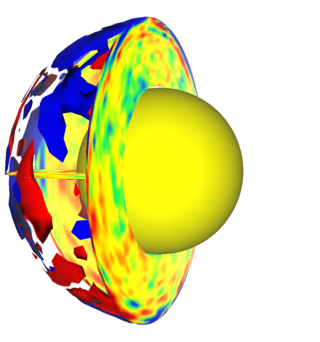
It visualizes isodepth (or isoradius) of seismic tomography data. There can be two isodepths ("IsoDepth1" and "IsoDepth2"), Earth's surface ("Surface"), and the Earth's core surface ("Core") with their opacities ("Opacity1", "Opacity2", "Opacity (Surface)", and Opacity ("core")). The depth of isodepths and the graphics of Earth's surface can be selected from the dropdown lists. Color of the core can be changed. Cross-Section
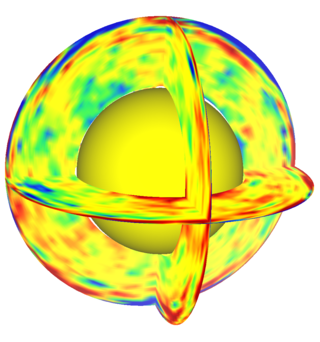
It visualizes cross-section of seismic tomography data. There can be three cross-sections ("Cross-Section1" to "Cross-Section3"). The cross-sections pass through the Earth's center and its angles are determined by "θ" and "ϕ". θ and ϕ specify the normal vector of cross-sections by polar coordinate system (θ = 0° at the north pole and 180° at the south pole with a domain of [0°, 180°]. ϕ = 0° at the prime meridian and 180° at east longitude 180° with a domain of [0°, 360°].). The normal vector ( θ, ϕ ) of cross-section that passes a great circle between 2 points of (latitude, longitude) can be calculated by cross-section calculator.
If "Spin" checkbox is checked, the cross-sections are fixed to the Earth. If it's not, they are independent from the auto rotation around the spin axis.
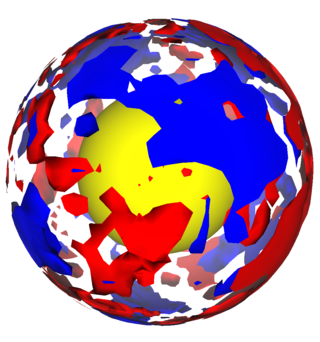
IsoSurface
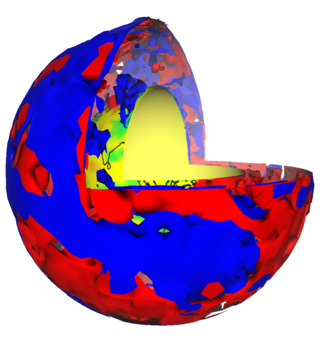
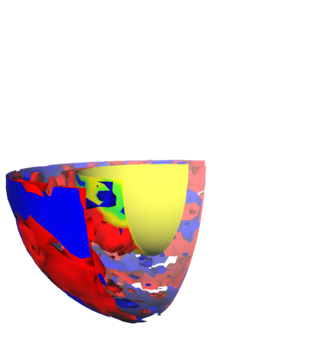
It visualizes isoSurface of seismic tomography data. There can be two isosurfaces ("IsoSurface1" and "IsoSurface2"). Value of isosurface can be adjusted by sliders. Color of the isosurfaces can be changed. The visualization domain of radius of the isosurfaces can be narrow down by selecting "Upper Bound (km)" and "Lower Bound (km)" by sliders.
Clipping Plane
Objects are clipped by the clipping planes.
There can be three clipping planes ("Plane1" to "Plane3"). The planes pass through the Earth's center and its angles are determined by "θ" and "ϕ", similarly to cross-sections. Objects in the side of the normal vector is visualized. If "Intersection" is checked, objects that are located in the intersection of all the unclipped domains of clipping planes are visualized. If "Intersection" is unchecked, objects that are located in at least one of the unclipped domains are visualized.
If "Spin" checkbox is checked, the clipping planes are fixed to the Earth. If it's not, they are independent from the auto rotation around the spin axis.
Objects to be clipped are selected with corresponding checkboxes.
Position
Coordinate of the camera is displayed at "x'(Camera)", "y'(Camera)", and "z'(Camera)". Inclination of the Camera from North Pole direction is displayed at "Inclination (Camera)". The Earth's radius is normalized as unity. The position of the Earth's center is (0, 0, 0) if (X, Y) for "Earth Position of Display"
is (0, 0). (X, Y) for "Earth Position of Display" shows the Position of the Earth's center on the screen coordinate. The position of camera, its inclination, and the screen coordinate of the Earth can be handled by mouse and arrow keys, respectively.
- NorthUp Make the North Pole point upward on the screen.
- Initialization Initialize the Position menu. Note that the initial position specified by "Initialization" button does not change even if it is imposed by URL query parameters or config files.
View
- Latitude, Longitude It visualizes lines of latitude and longitude of two different radii ("Latitude, Longitude 1" and "Latitude, Longitude 2"). Radii can be adjusted by sliders.
- Axes Shows X, Y, Z axes.
- Fog Add fog effect.
- Color (Background) Change background color.
- Fullscreen Move to the full screen mode. The full screen mode is canceled by ESC key.
- Depth, θ, ϕ The coordinete of the pointing place of the mouse is detected when the mouse buttons are pushed. Radius and depth are mutually converted by Radius = 6371 km - Depth.
Speed (Spin)
Change the Earth's spin rate. The spin is clockwise when the rate is positive.
Data Source
Change the visualization data to P-wave, S-wave, etc. depending on contents.
Link (HMSL-SP06)
Link (HMSL-SP06)
Link (HMSL-SP06)
Link (HMSL-SP06)
Link (HMSL-SP06)
Link (HMSL-SP06)
Useful Tools
Cross-Section Calculator (Link)
Calculation of "θ" and "ϕ" of the normal vector for cross sections from two sets of (Latitude, Longitude).